
TrueInsight
Siemens/Altair Channel Partner
Menu


System Characterization in Altair PSIM
This blog post explains the importance of system characterization in Altair PSIM and how it can help you accurately simulate your power systems.
Power electronics are at the heart of almost all new electronic and electrical technology, so it makes sense that there is always a need to characterize and control these circuits. This is where Altair PSIM not only enters the scene, but also dominates the stage. PSIM is at the forefront of design, analysis, and simulation of power electronics and full circuit schematics. There are many possibilities within the tool to aid in necessary engineering processes, but today we will take a brief look at system characterization. The end goal of many electric circuits almost always includes a robust control system, and designers must be able to properly characterize their models if they wish to accomplish this.
To showcase one of the methods of analyzing an existing model, we will walk through a simple example of performing an AC sweep on a buck converter in PSIM. The table below shows the values selected for this buck converter.
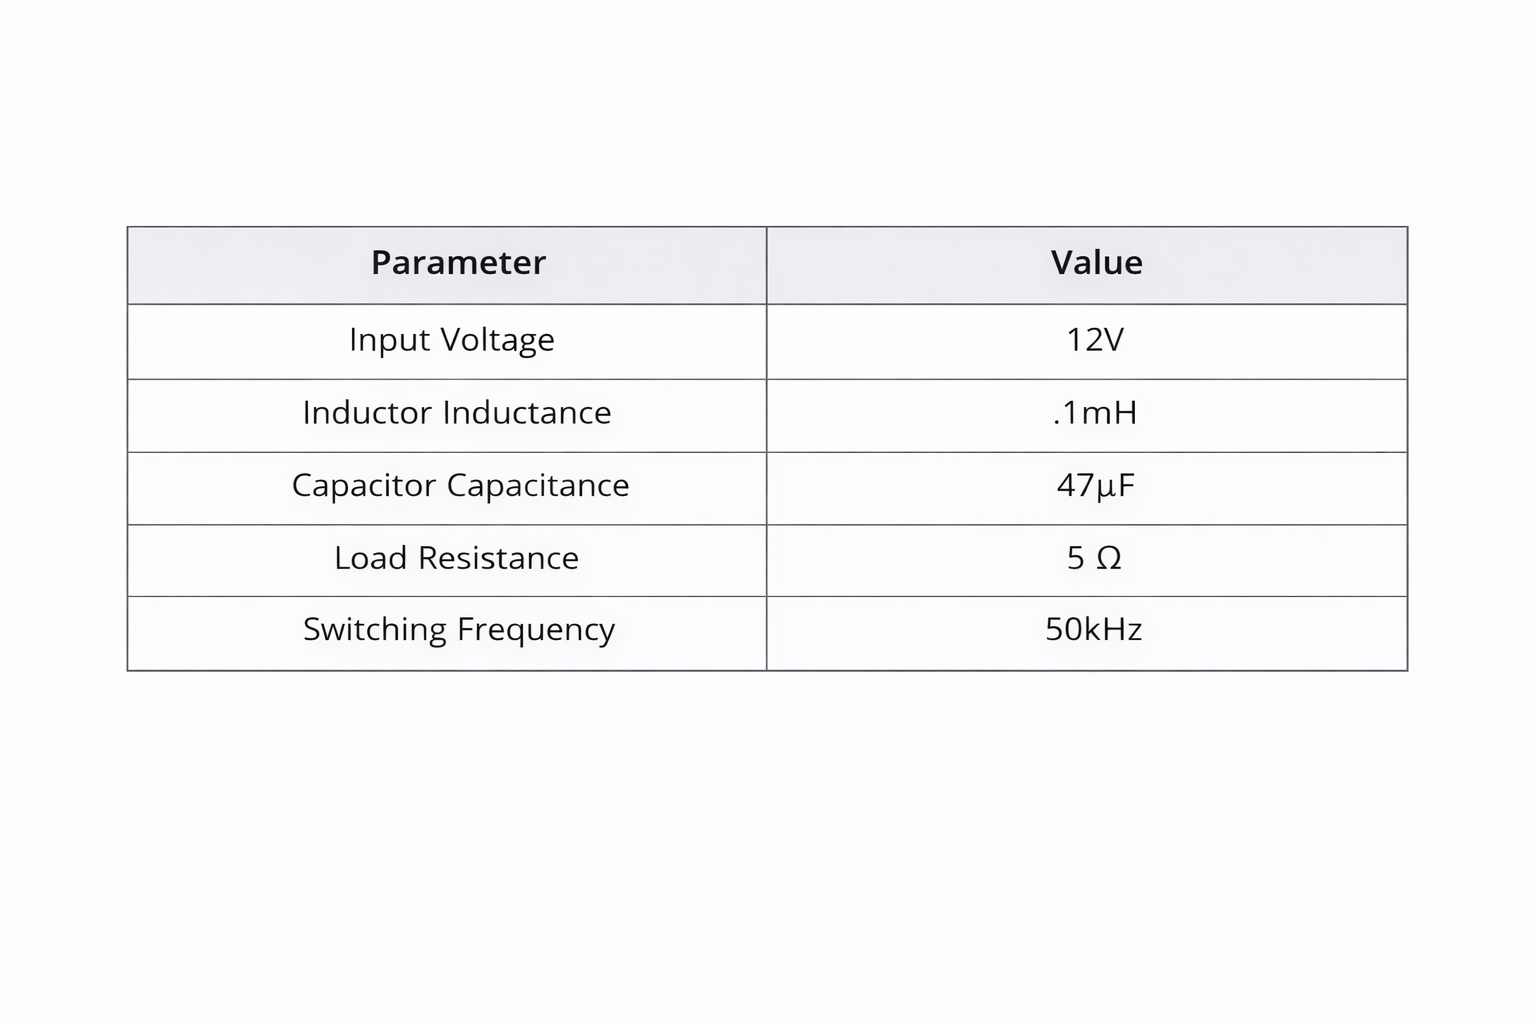
Fig 1. Table of device parameters.
Figure 2 below shows the schematic of the buck converter in PSIM before we start adding any analysis features. This model does not include the subcircuit to drive the switching of the MOSFET, but it will be discussed shortly. It is worth noting that, while the components selected for this example are all ideal, PSIM does allow you to define various nonidealities, which are discussed below.
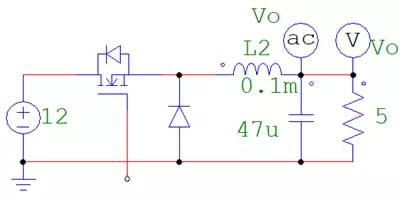
Fig 2. PSIM schematic of Buck Converter
Figure 3 shows the various parameters available on a handful of components in PSIM to model more accurate and nonideal circuit elements at various levels of detail. Each new level of accuracy opens the option to include more physical and electrical properties of the device. If there is any confusion about what a specific variable is requesting, the “Help” button in the upper-right corner of the dialog box for the component will open a detailed description of each value, and examples are often included.
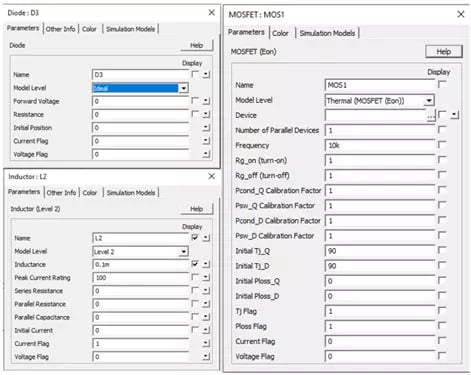
Fig 3. Component simulation level and parameter specification
Now that we have our model and we have decided to maintain an ideal environment, we can implement the switching subcircuit, as well as the AC Sweep block to get the frequency response of the buck converter. Figure 4 depicts the signal-based comparator to drive the gate of the MOSFET in the converter, where the red-highlighted box is only added as part of the AC sweep. When using the AC Sweep block, the sinusoidal source added must share the exact same name as the “Source Name” within the block for the sweep. The values for frequency and amplitude plugged into the source itself are not necessarily important, as the values in the AC Sweep block will pass over a specified range of frequencies and amplitudes. In addition to the simulation block, we need to add the AC Sweep Probe to the output. This ground-referenced probe automatically measures the output with respect to the phase and amplitude of the perturbation, which generates the Bode plots without needing additional inputs or configuration.
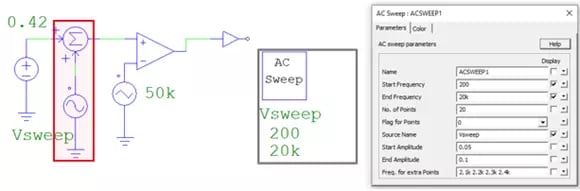
Fig 4. Gate-driving subcircuit and AC Sweep components
The start and end amplitudes, as well as the start and end frequencies, of the AC Sweep can be ‘ballparked’ with some initial testing. The important factors to consider when setting this up are as follows: ensure that the range of frequencies of the perturbation do not interfere with the performance of the converter, do not increase the frequency so much that there is no longer a signal to be measured, and do not exceed the amplitude of the carrier waveform. After finding satisfactory values, we can go ahead and run the simulation, open Simview, and view the frequency response of our circuit, as seen in Figure 5.
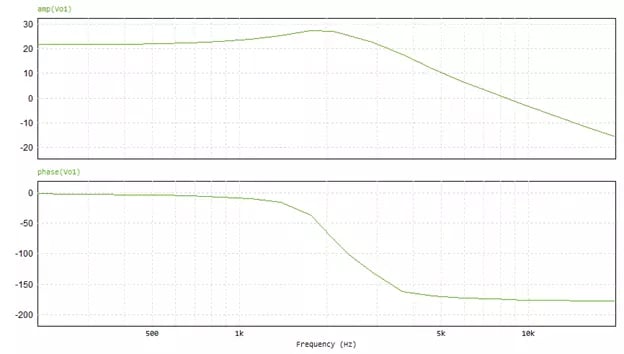
Fig 5. Bode Plots of Amplitude (top) and Phase (bottom) of the Buck Converter
At this point, we have successfully characterized our model and identified its frequency response! With this information in hand, we have several options for further progress in the design phase. We could export this information and use equations or additional software, such as Altair Compose, Activate, or Embed, to aid in the design of a control system for this device. Check out some of our other blogs or our YouTube channel to learn more about PSIM and the rest of the Altair suite of tools. Additionally, feel free to reach out to us directly with any questions or comments you might have!