
TrueInsight
Siemens/Altair Channel Partner
Menu


Generate Motor Drive Efficiency Maps in Altair PSIM
Find out how Altair PSIM helps users generate more efficient motor drive design processes
Motor and motor-drive efficiency contours and maps are effective visual aids for engineers to analyze the performance of their systems over a range of applied speeds and torques. With this data, designers are able to learn more about their motor, inverter, and entire motor drive, such as the one constructed in Figure 1 below. Usually, generating the information necessary to create these efficiency contours is quite tedious; it can involve manually solving multiple batches or combinations or inputs, necessitating a wide range of input sweeps. Not only can this be very time consuming, but it is also prone to error, as users can easily skip inputs or mis-record outputs by accident. Luckily, Altair PSIM has a solution to streamline this process, getting you the results you need efficiently and accurately.
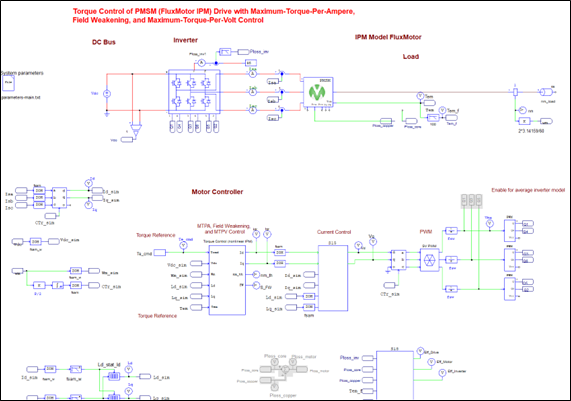
Fig 1. Example Motor Drive schematic in Altair PSIM.
This is completed by the pre-loaded and customizable efficiency maps.script script consolodates all of this work into a few simple steps. You can access this script within the installation directory of Altair PSIM on your machine; specifically, you will find it in the installation’s subdirectory examples > Script or you can modify an in-use template in one of the Case Study > Efficiency Map(s) example folders.
The automation, shown in the script editor in Figure 2, is configured to handle most of the repititive tasks for you, only requiring you to make a few adjustments:
- You must provide the file name and location of the motor drive you wish to analyze
- You must provide the range of speeds [rpm] you wish to canvas, named arr_nm
- Example: arr_nm = {250, 750, 1250, 1750, 2250}
- You must provide the range of torque [Nm] you wish to canvas, named arr_Te_cmd
- Example: arr_Te_cmd = {10, 30, 50, 70, 90, 110, 130};
- You must provide the range of max torques applied at each speed, named arr_Te_cmd_limit
- Example: arr_Te_cmd_limit = {131.6, 131.6, 90, 63, 50};
- This must be the same length as arr_nm
- From there, all you need to do is run the script and wait for the “Script run completed” message!
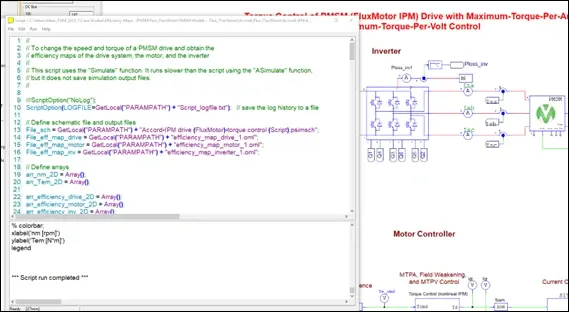
Fig 2. Efficiency Map script in Altair PSIM.
If you look in your file directory storing your motor and script (the directory you are currently working in), you will likely notice a few new files. This is expected as part of the automation in Altair PSIM. For example, you may see a new schematic file like the one displayed in Figure 3: this auto-generated subcircuit is used to calculate losses and efficiencies within the motor drive.
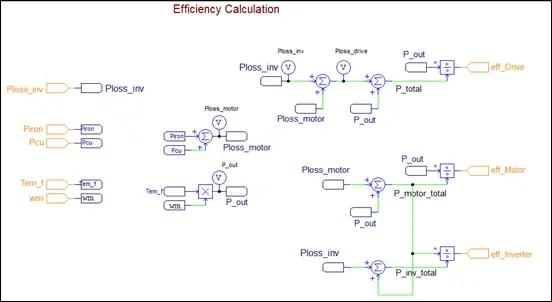
Fig 3. Automatically created efficiency calculation subcircuit schematic in Altair PSIM.
Schematic files are not the only automatically generated outputs of this script, though. In fact, the main exports are the OML (Open Matrix Language) files that are coded and saved without needing user input. These programs can then be opened and executed in any OML compiler, such as Altair Compose, which almost all Altair PSIM users will already have access to! Figure 4 below highlights the three main scripts: one for each efficiency contour of the motor, inverter, and motor drive.
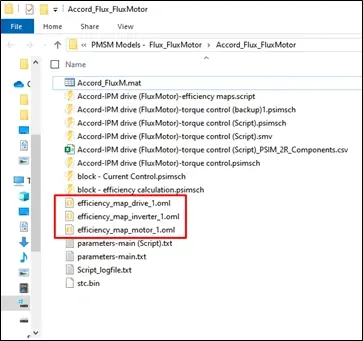
Fig 4. Automatically created OML files after running script in Altair PSIM.
These files are immediately ready to run and require no further editing to immediately create an initial speed-torque efficiency map. Figure 5 demonstrates opening the OML file for the motor and simply clicking run in Altair Compose. You can see that it creates the contour plot for us, with speed along the x-axis, torque along the y-axis, and color representing efficiency. There is also a color-bar acting as the legend for this coloring scheme. We can easily repeat this for the other two files without making any changes to the OML. Just like that, the maps are already generated, and it didn’t require any manual sweeping, parameterization, or coding.
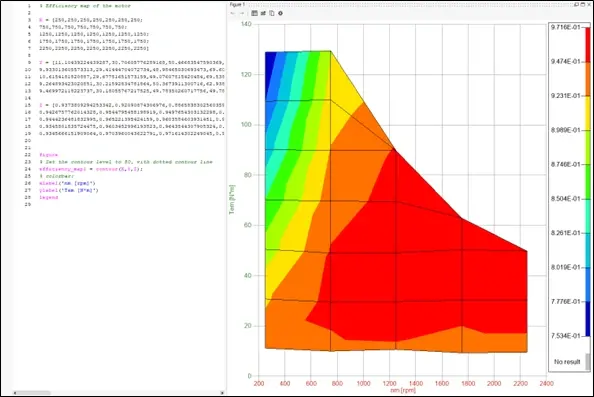
Fig 5. Output of automatically generated OML to produce Motor Efficiency Map in Altair Compose.
However, you can take it a few steps further if you properly leverage the strengths of Altair Compose. This powerful software is capable of performing complex calculations, transformations, and automations on large sets of data, especially in matrix format. Compose is also extremely capable when it comes to visualization of results, whether they were generated within the tool itself, or imported from an external solution, such as this example. If you would like to learn more about the no-code/low-code approach to visualizing data in this software, be sure to check out our video on Customizing 2D and 3D Plots without writing code in Altair Compose. By using the Plot Assistant, you can easily generate a 3D contour of your results, such as the one depicted in Figure 6.
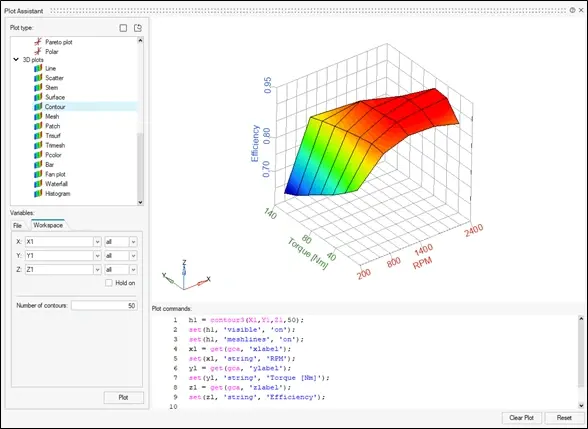
Fig 6. Example of 3D Contour Plot available in Plot Assistant in Altair Compose.
Additionally, you can use a combination of the tactics covered in this blog post to showcase the overall results of your simulation. For example, Figure 7 shows what it might look like to include all three sets of results in one OML file and to plot them together with one color-bar.
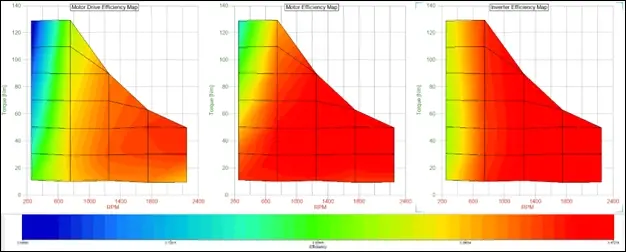
Figure 7. Finalized Torque-Speed Efficiency Maps using Altair PSIM & Altair Compose.
This brief overview of the automatic speed-torque efficiency map generation in Altair PSIM should allow you to expedite your design, simulation, and testing phase significantly. You can further improve the effectiveness of this tool by incorporating other software programs that you most likely have access to with your Altair license, such as Altair Compose. If you would like to learn more about this process, more about either software covered in this blog, or more about the overall portfolio of Altair Engineering Solutions, please do not hesitate to reach out to us directly! As always, be sure to check back here often for more content like this, and subscribe to our YouTube channel for even more video walkthroughs, demonstrations, and more.