
TrueInsight
Siemens/Altair Channel Partner
Menu


Holiday Shopping Analysis with Altair Monarch and AI Studio
In this post we use Altair Monarch and Altair AI Studio to collect, clean and analyze shopping trends in the holiday season
With the holidays just around the corner, I was curious what information I could extract about shopping trends during the gift-giving season versus other times of year. With the full suite of Altair Data Analytics to work with, I have many tools at my disposal, such as Altair Monarch to collect, process, and prepare any of my source data; this software allows me to transform it from a raw and unstructured arrangement into a cohesive and structured table of valuable information.
From there, we can use Altair AI Studio to further analyze the data intelligently and generate predictive models. To demonstrate these capabilities, let’s look at the shopping data at a collection of Walmart locations over a two-year period, which is publicly available here.
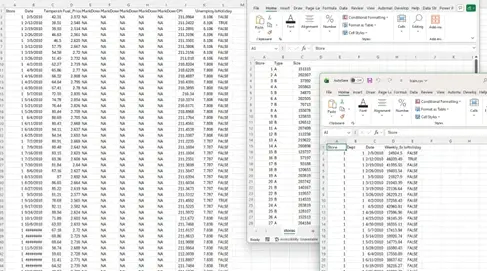
Fig 1. Raw input data in spreadsheet form.
The source data, shown above in Figure 1, is broken down into three separate spreadsheets, each one containing either information about a given store or shopping data for a given week:
- One spreadsheet contains the store ID, calendar week, whether it is a holiday week (any time in November or December for this study), and other possibly relevant data, such as the local unemployment rates, gas prices, or temperatures during each week.
- The next contains each Store ID, a category indicator (WalmartMarket, Full Size Walmart, etc.), and the size in square feet
- The final sheet houses the Store and Department ID, calendar week, and total weekly sales [$].
From here, we can use Altair Monarch to automatically extract data from each of the spreadsheets. Figure 2 below shows where I have selected the columns of interest, excluding the MarkDown attributes, as they are irrelevant to my specific case.
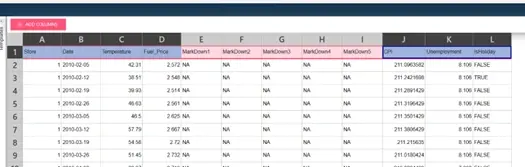
Fig 2. Choosing relevant attributes and clicking ADD COLUMNS in Altair Monarch.
After adding the desired columns, I can automatically define the Headers to clarify what this new table represents, as seen in Figure 3. We can repeat this process for each of the three spreadsheets, resulting in three custom data tables in our Monarch workspace.
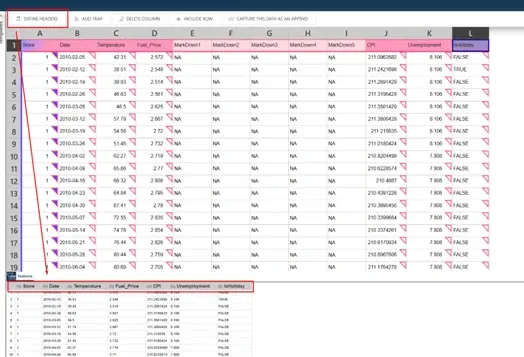
Fig 3. Automatically defining the headers of imported data in Altair Monarch.
Before making any advanced adjustments, we can make minor corrections, such as the one exemplified in Figure 4. The original format for the Date column was Date/Time, but the time of day is irrelevant to this example, so we can automatically update the entire column to more closely fit our needs.
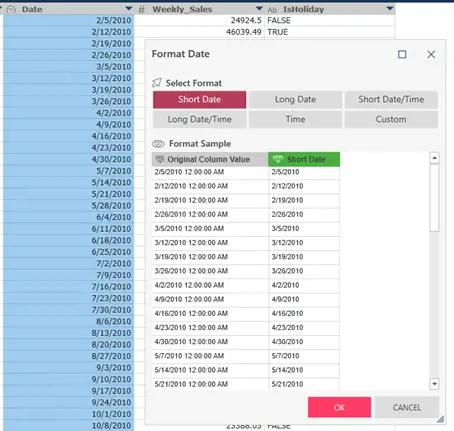
Fig 4. Modifying column data formats in Altair Monarch.
Let’s also suppose that we are not interested in numbers based on each department, but the entire store during each week instead. We can use the “Group” function to aggregate specified values based on custom grouping. Figure 5 shows where we grouped by Store ID and the Date, while summing the sales for that week (for all departments), and retaining the Boolean holiday flag.
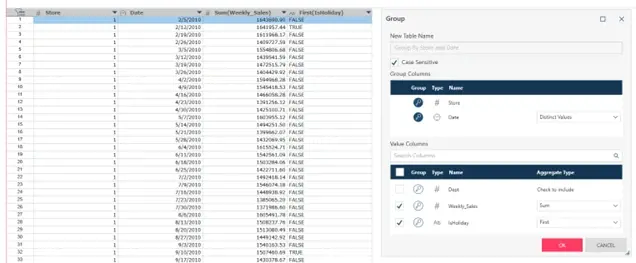
Fig 5. Grouping data and summarizing data based on custom conditions in Altair Monarch.
Next, we can start combining the various data tables we generated from the separate spreadsheets. First, we will add the type of store and its size based on the Store ID. This “Join” operation can be seen in Figure 6, where the Store is selected as the “key” and the new “lookup” values are added as columns to the initial dataset.
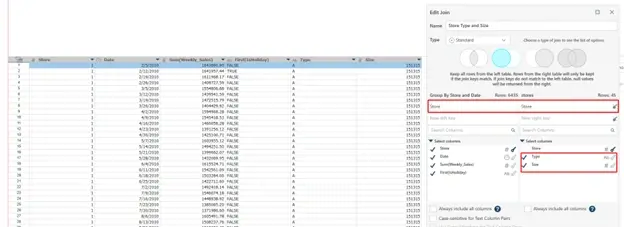
Fig 6. Joining two datasets using one matching key in Altair Monarch.
Similarly, we can perform a slightly more complex “Join” operation utilizing two “keys” instead of one. In this case, the matching will only occur if the Store ID and the Date match across the datasets. Figure 7 shows how this allows us to add additional details, such as temperature and gas prices, to the existing table financial and physical about each location.
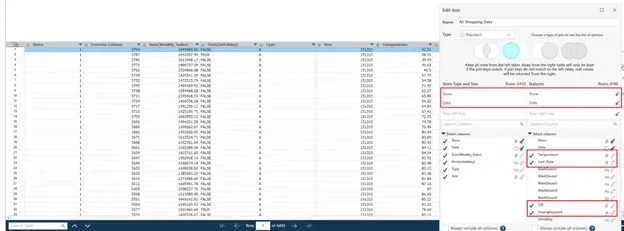
Fig 7. Joining two datasets using two matching keys in Altair Monarch.
With this complete dataset in hand, we are ready to utilize it in whatever form of predictive modeling we desire. To demonstrate this, we’ll use Altair AI Studio to see if we can identify any interesting relationships withing the data around the holidays. Initial attempts only led to the conclusion that larger stores tend to have high sales, so I decided to generate a new attribute for our data within AI Studio’s data preparation module. Figure 8 shows how I created a new formula to calculate the dollar amount of sales over the square footage of each store on a given week, and titled it Dollars per Square foot.
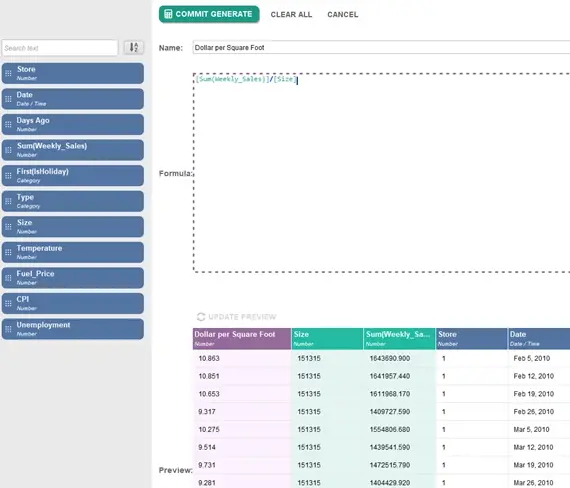
Fig 8. Generating a new column of data based on a formula in Altair AI Studio.
With this new Dollars per Square Foot column, we have a fairer method to compare the performance of each store. There are countless ways to utilize AI Studio for this analysis: we could build a custom process with almost any kind of artificially intelligent model, create visualizations, or use the Auto Model module to quickly compare various models. This is an excellent launch point for developing more complex and customized designs, so let’s look at how to use it. Figure 9 gives an overview of the tool after the dataset has been loaded in:
- Select Task – Choose a supervised predictive, unsupervised clustering, our outlier detecting model backbone
- Prepare Target – Confirm label, ID, or prediction column; choose discrete or continuous ranges
- Select Inputs – What other columns to include as factors in the model
- Model Types – Neural Net, Decision Tree, Bayesian, k-Means, x-Means, etc.
- Results – The outputs, comparisons, and simulators for each model
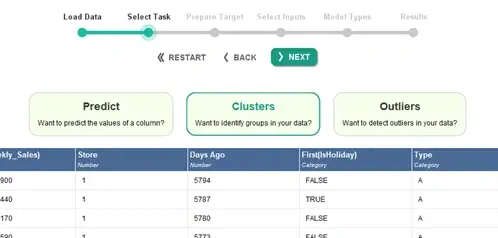
Fig 9. Preparing the Auto Model module in Altair AI Studio.
For this study, I chose to identify any potential clusters within the data. I kept the default of 2 clusters for the k-Means approach and allowed a maximum of 20 for the x-Means algorithm. Figures 10 and 11 display the overall results of these cluster algorithms and the comparisons of certain attributes within those clusters.
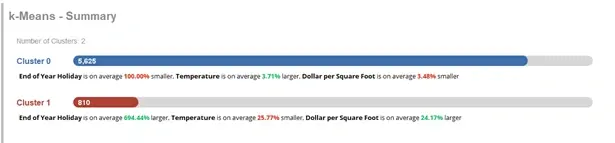
Fig 10. Results of k-Means clustering in Altair AI Studio.
Unsurprisingly, our k-Means clusters show that when it is holiday season, temperatures are typically lower and unit spending is higher. All Walmartsin this example set are in North America, so it makes sense that it would be colder in November and December. It is also interesting to see the significant increase in unit spending during these weeks.
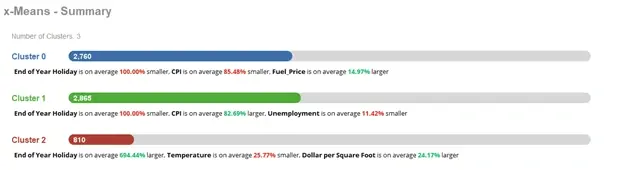
Fig 11. Results of x-Means clustering in Altair AI Studio.
Our x-Means clusters, plotted in Figure 12, reveal some similar, but slightly different information. Again, we see the trend of increased spending during the holidays, but we also have two other interesting relationships: the Consumer Price Index (CPI) decreases when gas is more expensive, and it increases when unemployment is down. These aren’t unexpected results, but now we have a clear way to quantify these comparisons.
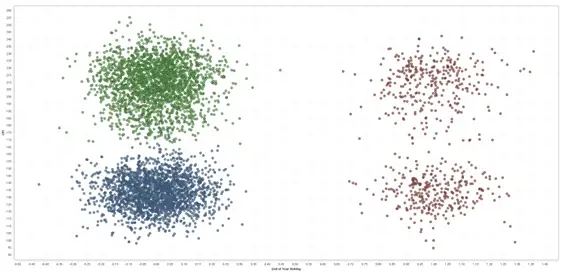
Fig 12. Plotted results of x-Means clustering in Altair AI Studio.
Finally, we can look at the correlation table in Figure 13, which also provides some quantifiable relationships between various attributes. There are definitely some correlations (or lack thereof) that surprise me more than others. What about you? Did you expect to see any other trends around holiday gift-shopping?
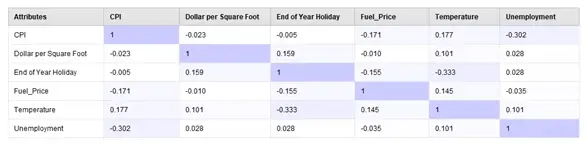
Fig 13. Attribute correlation matrix in Altair AI Studio.
With all this processed data in hand, and with our initial models, we can proceed however we desire from here, such as adding more attributes to identify better clusters, increasing the size of the data set, or training a full-scale predictive model, but I will leave these as inspirations for the readers. If you would like to learn more about how we analyzed this holiday shopping data, the tools we used (Altair Monarch & AI Studio), or the entire body of solutions provided by Altair Data Analytics, reach out to us directly. For more content like this, be sure to subscribe to our YouTube channel!