
TrueInsight
Siemens/Altair Channel Partner
Menu


How to Extract Information from Excel Using Altair Monarch
Altair Monarch can extract data from Microsoft Excel or Google Spreadsheet files, in this post we show you how.
Altair Monarch is the premier tool for data extraction, cleansing, and preparation. Some users may even look at the interface of Altair Monarch and think that it is simply a replacement for spreadsheet software, like Microsoft Excel or Google Spreadsheets, but that is not the case; in fact, these tools can cooperate seamlessly, as these files can be used as data sources in Altair Monarch!
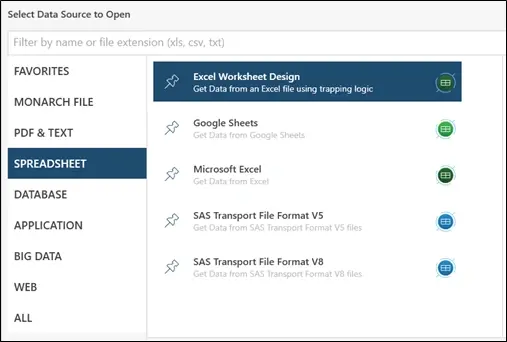
Fig 1. Examples of the types of data sources, specifically spreadsheets, that Altair Monarch can import.
To begin working with spreadsheets in Altair Monarch, we can simply begin the process of adding or importing data into our workspace, and we will select “Spreadsheet” as the type of data source, as shown in Figure 1. From there, we can choose from a range of choices, including Google Sheets and Microsoft Excel. For this example, we will use the Excel Worksheet Design tool to show how we can use trapping logic to capture data from spreadsheets with complex structures.
Figure 2 below shows the initial view when a spreadsheet is imported into Altair Monarch. This spreadsheet is organized in the “traditional” fashion, where the first row represents the headers, each column represents a different attribute, and each row is an entry in our dataset. We can actually use the normal Microsoft Excel import tool to directly bring this into our workspace, but we will take a look at how we can use some simple trapping logic instead.
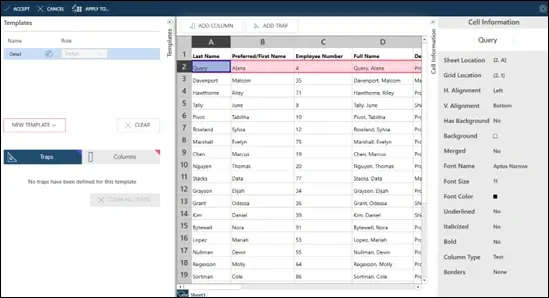
Fig 2. Example input of “traditional” spreadsheet into Altair Monarch.
To begin, we can select a cell containing information of interest to us. Figure 2 above shows that I have selected A2, the first entry of a Last Name in our dataset, and I simply clicked “Add Column,” generating the first output column of data, as shown in Figure 3 below.
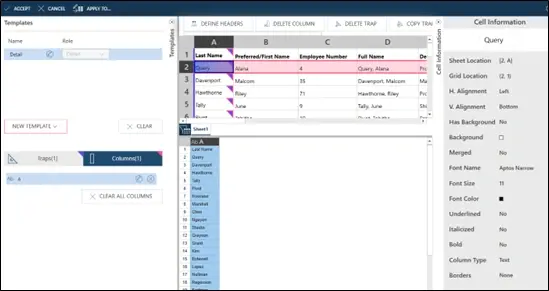
Fig 3. Result of “Add Column” before modifications.
One issue you may notice, however, is that the first row of our output data includes the header of our input table as a value. To resolve this, we can simply select the first cell, A1, and click “Define Headers,” generating the correct column of data, depicted in Figure 4.
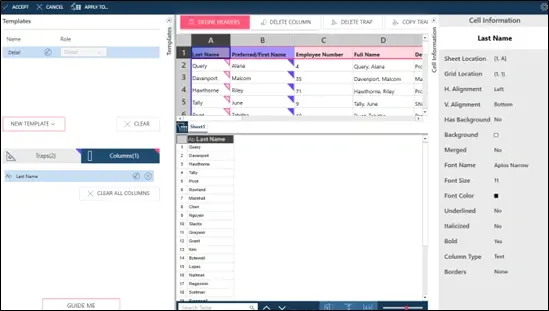
Fig 4. First output column after defining headers.
Figure 5 exemplifies the simplicity of this process as it is repeated over several of the columns in the input data, which allows us to create a custom table of information. We can now prepare and process this data in Altair Monarch as needed.
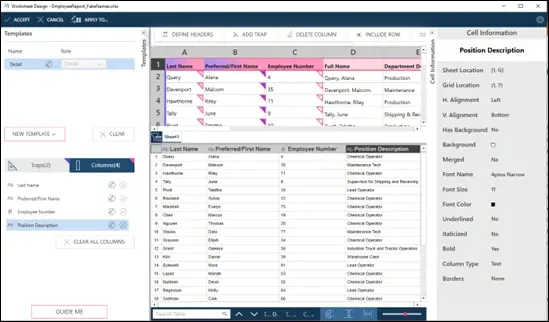
Fig 5. Result of output data after repeating process throughout input spreadsheet.
Now we can look at a more complex example: suppose we have a spreadsheet that is not so neatly organized. Figure 6 demonstrates one such spreadsheet, where some data is entered one row after another (the “Scheduled Start Time” and “Scheduled End Time” date/time values), while other information above those data points is stored side-by-side (such as the “Employee Number” and “Employee Name”). We cannot use the same approach as the first spreadsheet, as some columns contain too much information, and other contain too little. For example, Figure 6 displays the result of clicking “Add Column” while B9 was selected, and you can clearly see that the trapping logic captures the data points, but it also accidentally captures what we would consider the field labels for several different fields.
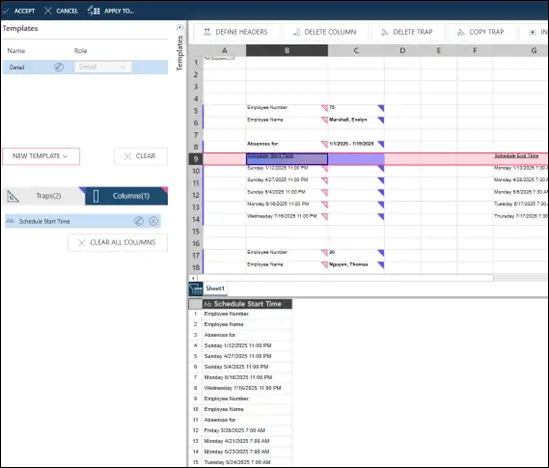
Fig 6. Example of messy input data and improper extraction.
To resolve this, we can customize the trapping logic using the panel on the left of the screen, which is shown in more detail in Figure 7 below. We can see that the traps are using the Value, Alignment, and Font parameters of Column B, and the Font parameters of Column C to trap the data.
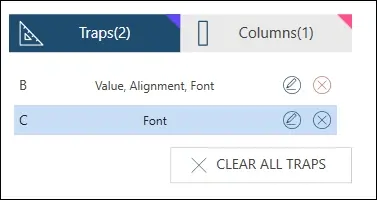
Fig 7. Close-up of trap customization menu.
To fine tune our trap, we have several options, but for this example, I opted to examine the cells next to the data I am actually interested in. In Figure 8, you can see that all the date-times of the absences are not in bold (already accounted for in the B column trap) and they abut a blank cell in Column C; we can then adjust the C column trap as follows: Font > Bold > Negate. This tells our model that we want to fine tune the trap to only look for values in Column B (meeting all other criteria) that are next to non-bolded cells in Column C, which is a viable solution to this problem.
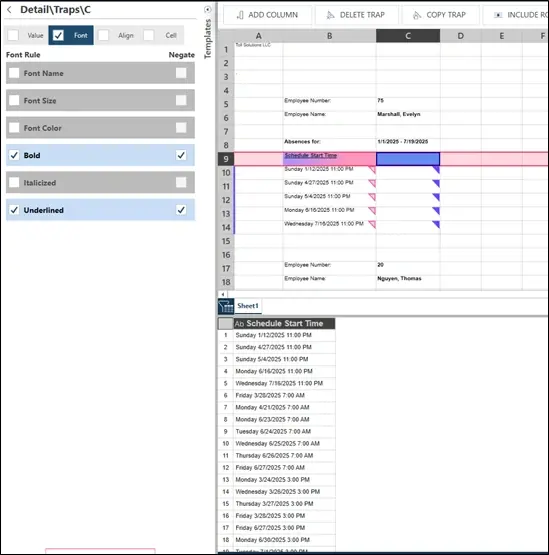
Fig 8. Result of customizing trap to clean up first data column.
Similarly, we will need to include our Append traps, as seen in Figure 9. Again, there are many possible routes that can result in the same data extraction, but for this example, I will just select the first “Employee Number” entry and choose “Add Column.”
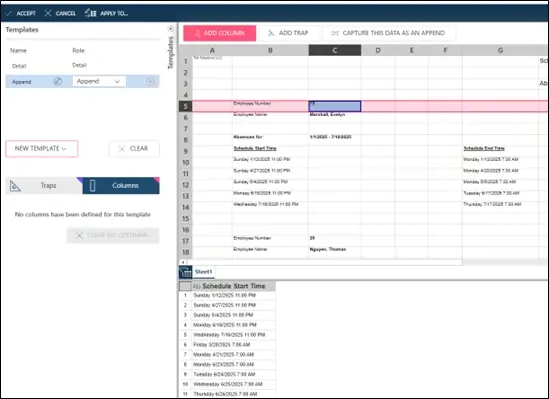
Fig 9. Using new trap to append data to output table.
Since the Employee number is already fairly unique in its formatting (bold and an integer value), the automatic trap does a good job of capturing this data accurately, seen in Figure 10. Also seen in Figure 10, though, are the problematic results when we try to apply this same process to Cell C6 in order to capture the “Employee Names.” You will notice that the automatic trapping logic is accidentally only capturing the values for “Absences for,” which we are not interested in for the purposes of this demonstration.
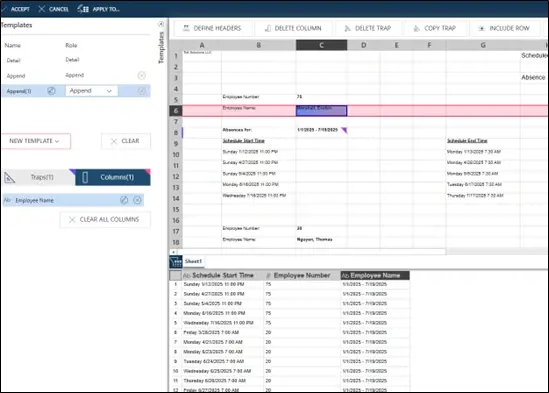
Fig 10. Example of incorrect data trapping with auto-generated trap.
To correct this, we can use a similar process that was covered earlier (see Figures 7 & 8). For this specific data point, we will alter the trap for Column C. We know that all the names will be organized by last name, a comma, and first name, and we know that none of the other data points in the column have commas in them, so we can add a condition to the trap that the information must contain a comma, as seen in Figure 11.
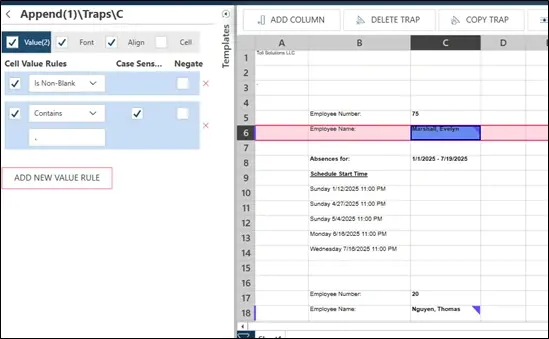
Fig 11. Modification of trap to capture the correct data.
Now we can see, in Figure 12 below, that our model is accurately capturing Employee Names in the modified trap. Just as before, there are multiple different methods that could result in the same output, so feel free to experiment with what works best for you and your data!
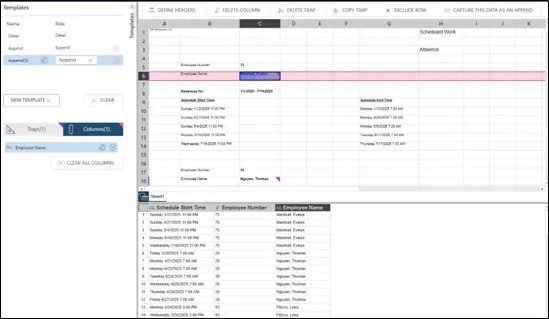
Fig 12. Overview of trapped data and correct output table.
This concludes the brief overview of the Excel Worksheet Design feature in Altair Monarch and how to apply it to spreadsheets ranging from basic to complex. With these tools at your disposal, you will be able to turn any unorganized array of spreadsheets into a tidy and tabulated dataset that fits your presentation, analysis, and post-processing needs. If you would like to learn more about data extraction in Altair Monarch, the software in general, or the overall portfolio of Altair Data Analytics solutions, please be sure to check back here often for more blogs like this, and subscribe to our YouTube channel for how-to videos, walkthroughs, and more!