
TrueInsight
Siemens/Altair Channel Partner
Menu


Control Design with Altair PSIM + SmartCtrl
In this blog post, we use a buck converter workflow to show how Altair PSIM and APA Product, SmartCtrl give users robust simulation solutions.
While the Altair suite of simulation software is quite extensive, allowing users to design, analyze, and optimize a wide range of systems, there are also many other tools offered through the Altair Partnership Alliance (APA). The APA includes tools that Altair does not produce “in-house,” but they are still available to users with the Altair Licensing model. There are many tools in the APA that can increase the productivity of engineers and the scope of designs even further and provide very detailed analyses of specific or niche applications.
One of the more prominent APA tools is known as SmartCtrl. This tool is a powerful control system designed software, and it allows users to define plants via transfer functions or circuit definitions or via import of frequency response data (Bode plots). From there, you can define how your feedback is measured and what type of control system you would like to implement. The software then allows users to view the real-time changes to controller, sensor, feedback, and closed-loop transfer functions within Bode phase and magnitude plots and the Nyquist plot in addition to a time-domain transient response. Users can see how all of these vary as the control parameters are adjusted, allowing users to fine tune their systems and avoid ill-conditioned controllers and unstable closed loops. An additional benefit of this tool is that it works very nicely with Altair PSIM, which is the premier power electronics design and analysis software. Users can get the frequency response of their circuit in PSIM, export it to SmartCtrl, design the controller, and then implement it back in PSIM to ensure functionality.
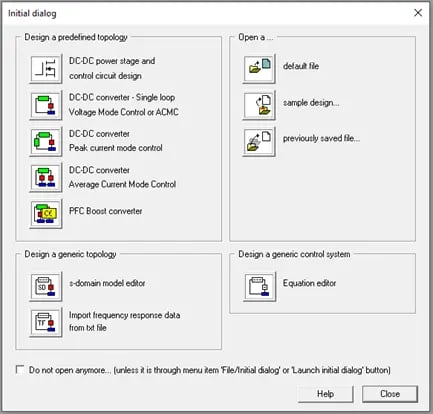 Fig 1. SmartCtrl initial options for control design.
Buck Converter Definition and Characterization
We will walk through this process of combining the power of PSIM and SmartCtrl using a simple buck converter as an example. Table 1 shows the values of the components used in this example buck converter.
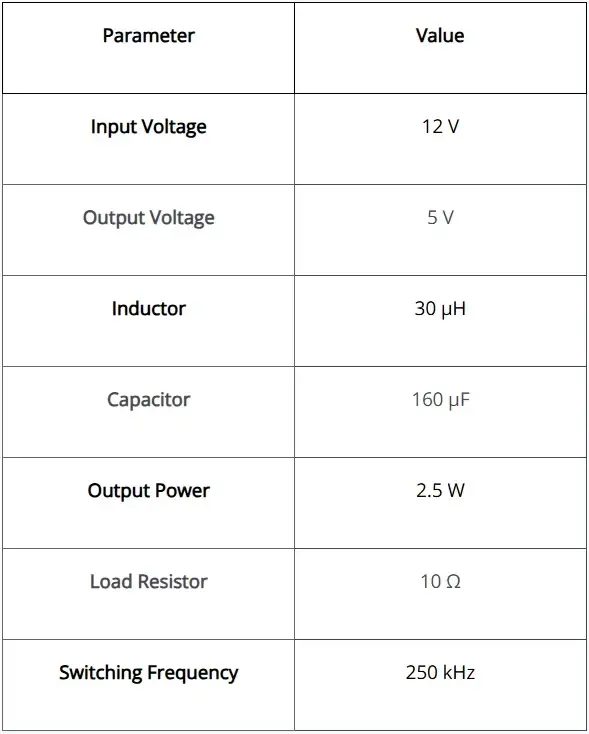
Table 1. Buck converter parameter values
To begin, we have a few options: we can either build our schematic entirely within PSIM and perform an AC sweep to characterize our model, or we can define the circuit parameters directly within SmartCtrl. We will opt for the latter in this example, but be sure to check out the previous blog post System Characterization in Altair PSIM if you are interested exporting the frequency response of a custom circuit.
Defining Closed-Loop Elements in SmartCtrl
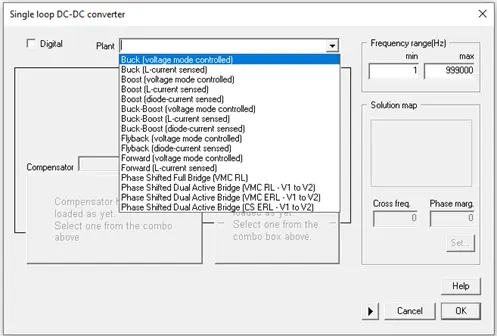 Fig 2. SmartCtrl plant options for power converters.
To begin, we will select our plant topology, a voltage mode controlled buck converter, from an extensive list of options, shown in Figure 2 above. Once we have selected the correct configuration, we can define the circuit element values, as shown in Figure 3 below. Note that we are assuming ideal components in this example, but the software allows users to define parasitic values, as well. This is also where users have the option to define if this will be a digital or analog system; we will stick with a completely analog implementation for this example.
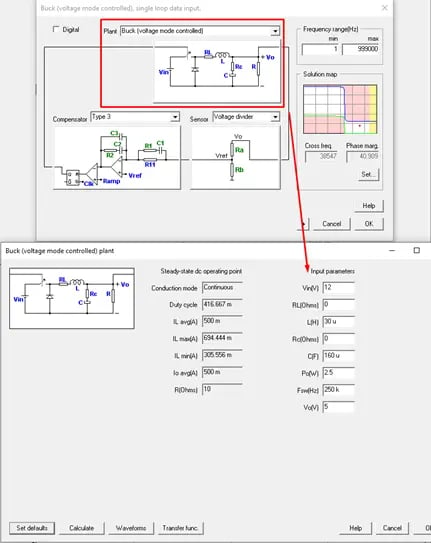 Fig 3. SmartCtrl plant selection and definition.
Next, we will need to define how we are measuring the output of the buck converter. We will choose a voltage divider, but other options include an embedded voltage divider and an isolated sensor, or it can be defined via a transfer function. Figure 4 shows where we have decided to use 3.3V as a reference, which will automatically generate the values for resistors in the divider. Note that we can choose any reasonable reference voltage to help us ensure the values of resistors are feasible.
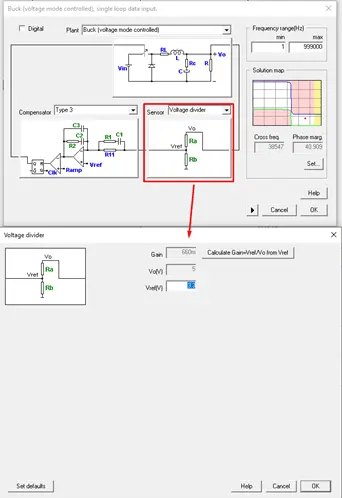 Fig 4. SmartCtrl sensor selection and definition.
The last step before tuning the controller is to select which controller topology we want to use. To give us as much stability as possible, we can implement a Type 3 controller, as shown in Figure 5. Here we can define the parameters for the sawtooth wave that will control the modulation.
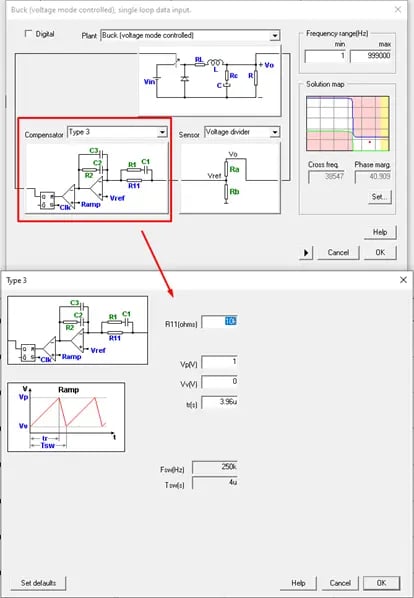 Fig 5. SmartCtrl controller/compensator selection and definition.
Now that we have chosen all the pieces for our closed-loop control, we can begin to tune and analyze performance. Figure 6 shows the SmartCtrl interface for choosing the crossover frequency and phase margin. The tool will let you know if your selections for these values are stable, unstable, or impossible to implement. As you change the phase margin and crossover frequency, you can see a live view in the changes to the following plots: Bode magnitude and phase plots (for plant, controller, closed loop, and open loop, etc.), Nyquist plot, step response, and individual waveforms (the PWM signal, and various currents and voltages within the devices).
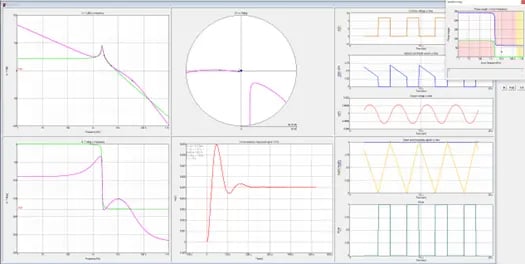 Fig 6. SmartCtrl controller design interface.
Verifying Results in PSIM
Once we are satisfied with the initial results, we have a few options to transition the simulation back to PSIM. The first option is to view the circuit parameter values directly in SmartCtrl and then manually build the circuit, feedback measurement, and controller in PSIM. Figure 7 shows that the software provides us with a complete list of values if we decide to use this method. We also have the option of directly exporting the model to PSIM, in which the entire schematic is automatically created, and all parameters are defined within a parameter file; this is the quickest way to migrate, and you still have the option of modifying the circuit after doing so.
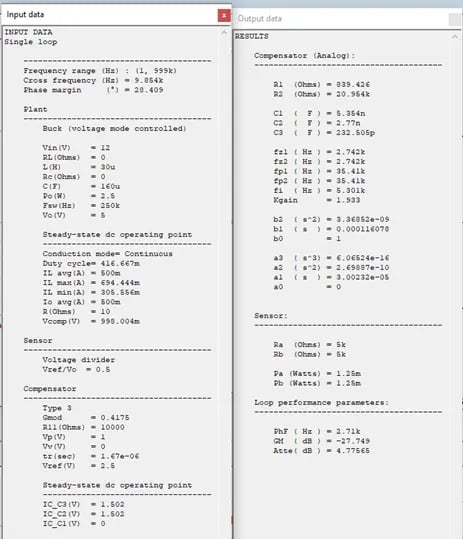 Fig 7. SmartCtrl input and output parameters.
Once we have moved everything over to PSIM, we can view the circuit, as shown in Figure 8. As mentioned, we can make any changes necessary, whether they are mere cosmetic changes to the layout or displayed information, or larger changes, such as modifications to topology or parameter values, if we so desired.
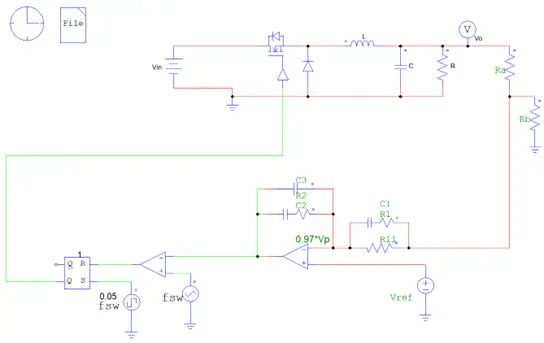 Fig 8. Buck converter closed-loop PSIM schematic.
All that is left to do is to run the simulation! Figure 9 shows the results of the output voltage and the current through the load. We can see that this controller quickly reaches steady state in approximately 0.2 ms with an overshoot of roughly 0.5 V. Depending on your specific application, you may decide this is adequate, or you may decide to return to SmartCtrl and make further modifications.
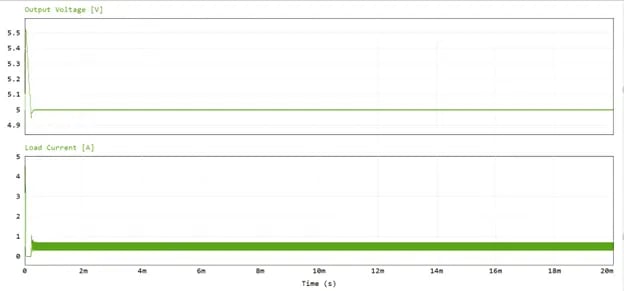 Fig 9. Buck Convert closed-loop output.
To verify the effectiveness of our controller, we can also inject some disturbance to the model. To demonstrate this, we can include a step voltage of 10 V at 10 ms and re-evaluate the output parameters. Figure 10 shows that the controller does an impressive job of rejecting the change in input voltage, quickly returning to steady state values.
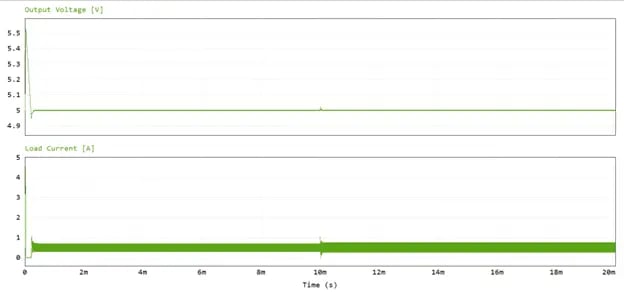 Fig 10. Buck converter closed-loop output with injected disturbance.
This was just a brief look at how SmartCtrl can increase the effectiveness of Altair PSIM even further than before! With these tools combined, engineers can increase their efficiency and accuracy in the world of power electronics and control. SmartCtrl and a wide range of other APA products can be available to you depending on your Altair license, so explore tools like these to see how we can improve your workflow. As always, don’t forget to check back here for more content like this, and be sure to subscribe to our YouTube channel for video walkthroughs, software tutorials, and unique examples.