
TrueInsight
Siemens/Altair Channel Partner
Menu


Altair RapidMiner AI Studio Part 2
In this post we look at using Altair RapidMiner AI Studio and how it can be used for predictive analytics, specifically Lego prices in this case.
In a previous blog post, I wrote about using Altair AI Studio, a tool within the RapidMiner family of data analytics tools, to collect, clean, and visualize data related to the pricing of Lego sets. That blog does show very helpful information when it comes to gathering large amounts of unsorted and raw data from various sources, such as the internet, and it walks through the process of extracting and displaying the most important pieces of that data, so I do recommend reading that post if you have not already done so (Understanding Altair AI Studio); however, that is far from the limit of what AI Studio is capable of. As the name implies, the software is extremely capable of streamlining the sequence that takes place between raw data and complete predictive models. Today, we will continue the work started in the previous blog to fully prepare our data, compare various methods of machine learning, and deploy a selected model, all within the same AI Studio interface.
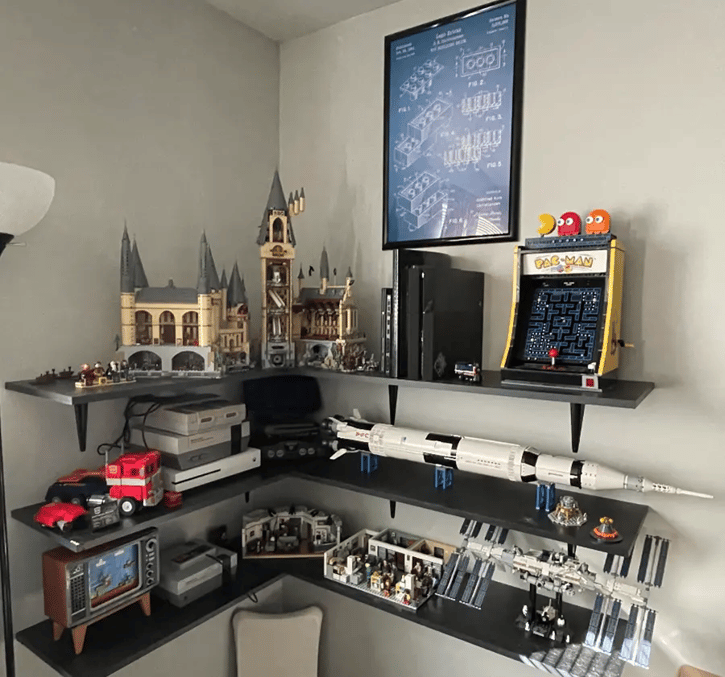 Fig 1. Another look at some of my completed Lego Sets.
Part I: Data Retrieval and Cleansing
To begin, I will retrieve the entire dataset that I collected in the previous post. From here, I will filter it to only include examples that have all of the data that I consider necessary for this project. For instance, I only want to keep rows of data where the following information is included: the release year, the availability (here I also filter sets that are not yet available at all), and the number of pieces in the Lego set.
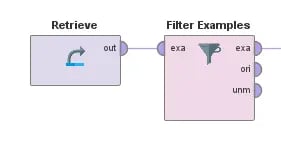 Fig 2. Retrieving and filtering data table values
Next, I need to do some cleaning of the data. There are many ways to accomplish this in AI Studio, but I will do so by creating a subprocess; this will allow me a more granular level of control over the type of data cleansing, while also keeping my overall model visually neat and uncluttered, which increases readability. Due to the way that the data was collected, some identical parameters actually have different attribute names; for example, on some pages, the current market value was stored as “Market Value,” while it was stored as “Current Value” on other pages. I will need to combine these results into one attribute or column in my data table. I also need to convert the data types of some of the attributes to enhance the trainability of the model. This includes converting the number of pieces from decimal numbers to integers and converting values to the same decimal structure. Any examples that cannot be fully cleaned are also filtered out here.
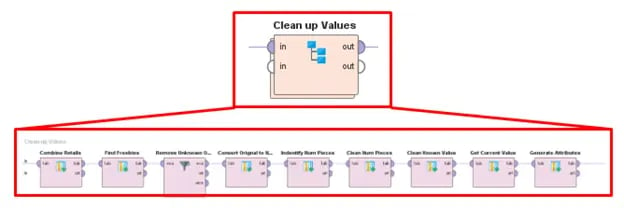 Fig 3. Using a sub-process to specify how to clean the data further
Now that I have created the finalized and “cleaned up” attributes that I am interested in, I can go ahead and remove the other attributes from the data table, which will make it easier to read, and it will help to avoid confusion about which attributes or parameters we are interested in.
 Fig 4. Using a sub-process to extract only the useful attributes
Finally, to avoid requiring this process over and over, we can go ahead and set the role and store the cleaned-up data. Setting the role will allow us to define one or more attributes as labels. In this project, we want to set the current market value as the label, as this is the value that we would like the model to predict. After that, we can store this pre-processed data as a new data table in AI Studio. This will allow us to retrieve this finalized information in any new model we create.
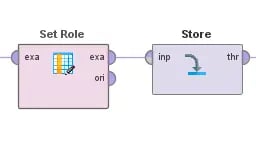 Fig 5. Preparing the data by applying a label to the output and storing it for later use
Part II: Predictive Modeling
Now comes one of the more interesting parts of the project: building the predictive model! The software is very open-ended when it comes to user choices in creating and customizing these data models. However, if you are new to the software or machine learning, AI Studio also offers many tools to expedite and streamline traditionally laborious tasks. For example, we can use the Auto Model tool to help us generate a predictive model based on our prepared data.
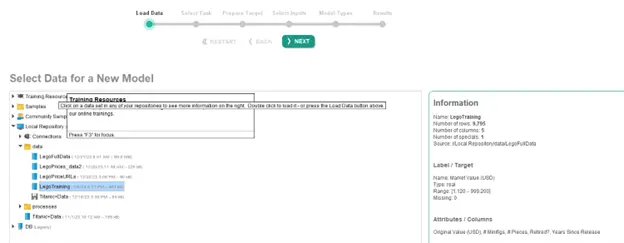 Fig 6. Launching the Auto Model tool within AI Studio
After loading the Lego data (from the data table we saved earlier), we can select the task we wish to accomplish. Our market value is already highlighted as our label, so we just need to select “Predict” as our task. Note that we can also generate clusters or identify outliers in the data using this tool.
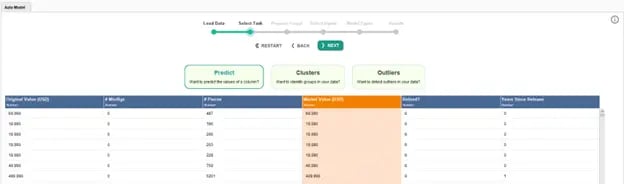 Fig 7. Selecting the goal and output of the Auto Model tool
Next, we are shown the distribution of the data, and we have the option to turn the model into a classification model rather than a prediction model. We will go ahead and move on to the next step as we want predictions of market value rather than classifications for this example.
 Fig 8. Visualizing the label/target data in the Auto Model tool
We can now select which attributes to include in the training. Auto Model will suggest which attributes to include or exclude based on varies measures of the data in that attribute. These include the correlation (how much the attribute mirrors the label), the ID-ness (how different the data is), the stability (how identical the data is), the percentage of missing data, and how much the data resembles text.
 Fig 9. Selecting attributes to include in training in the Auto Model tool
Next, we are presented with the options for the types of models AI Studio will automatically generate for us. These include Generalized Linear Model, Deep Learning, Decision Tree, Random Forest, Gradient Boosted Trees, and Support Vector Machine. There are also a handful of parameters that we can define. These can either speed up the model generation and training process at the expense of accuracy, or increase the accuracy of and robustness of the models at the expense of computational time. We will leave the defaults selected, but note that these options can change the outcome of this process.
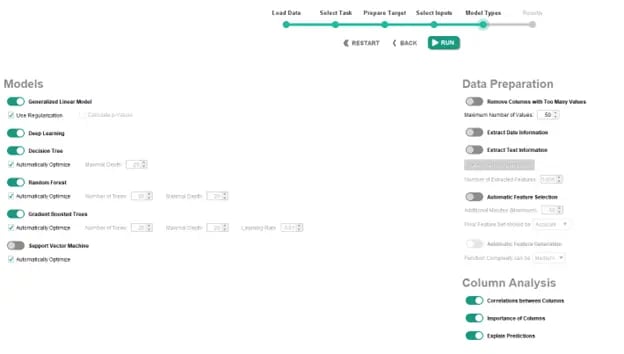 Fig 10. Selecting and customizing models in the Auto Model tool
After letting the models automatically train and validate, we can compare the results of each one. Immediately, we can compare the relative error, training time, and scoring time of each model. There is an extensive array of options at this point. We can look at the weights or training parameters of each model, compare the predictions to the true labels, or deploy the model of our choice, among many other options.
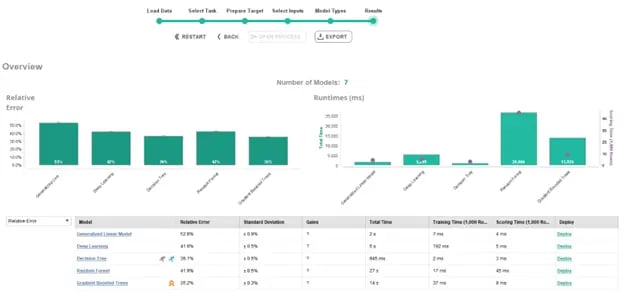 Fig 11. Viewing the high-level performance of the Auto Model tool
Part III: Customizing a Selected Model: Deep Learning
For this example, though, let us suppose that we would like to move forward with the Deep Learning option, but we are not satisfied with the automatically generated results. We can actually establish more specific training parameters and split the data as we see fit. For this example, I used the standard 70/30 split (70% of data used for training and 30% used for testing) to begin working on the customer deep learning model. I then incorporated my own neural network, in which I can define the amount and size of hidden layers, the activation functions, the number of epochs, the learning rate, and the loss function. It is worth pointing out that I changed my final hidden layer to only have one neuron and a Rectification (or Rectified Linear Unit, ReLU) activation function to ensure the outputs would be positive, as we can safely assume the value of the Lego set will never be negative.
There are actually several more customizations we can make to the deep learning block in AI Studio, but the previously listed parameters are often considered to be among the most important. Lastly, we can apply the model to the 30% of testing data that was not used during training to gain a deeper understanding of how effective the predictions are. We can even add a block to our diagram that will analyze the performance of these predictions, and it can provide useful information, such as relative error, absolute error, and root mean squared error (RMSE), among several other important measurements.
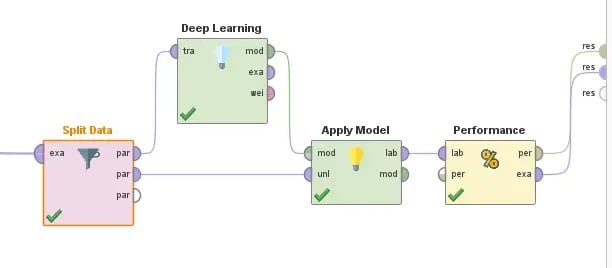 Fig 12. Designing, Implementing, and Testing a custom Deep Learning model
Part IV: Viewing the Results and Performance
After finalizing our model and running it, we can view a wide range of results. We can view the cleaned-up data that we generated earlier in this post, we can view the performance metrics of our model, and we can visualize the results. In this example, we can see that the distance to the ‘line of truth’ is a little better at lower market values, but begins to vary more as the current price increases. Overall, this specific model had an RMSE of approximately $97, which is not the most ideal, especially with these relatively small numbers. Perhaps we could improve this in the future with further testing or optimization, or maybe it lets us know that there isn’t really a great way to predict exactly how much a Lego set would be worth in the future. If gambling on future value was that easy, a lot of people on Wall Street would be out of a job!
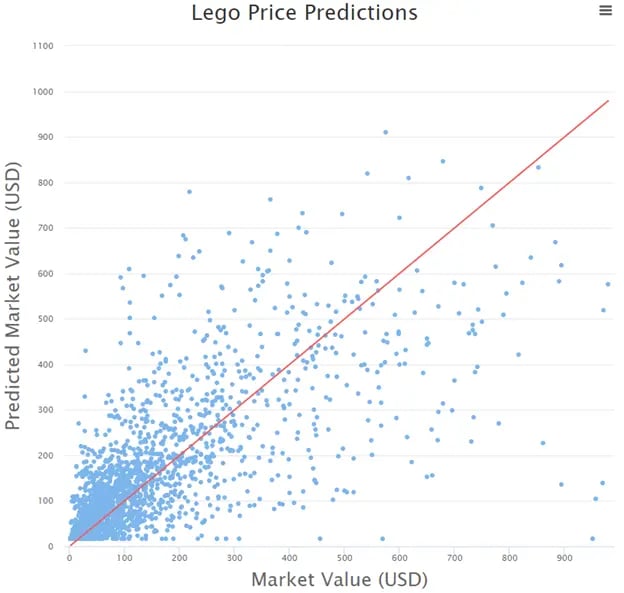 Fig 13. Viewing the True Market Values vs the Predicted Market Values
While this example didn’t give us a perfect predictive model, it does show just a little bit more of the impressive power and capabilities of AI Studio. There are endless options when it comes to applying this tool to your business, including gathering, cleaning, and modeling data. There are many routes to allow users to work effectively and efficiently, while also providing high levels of customization within an intuitive interface. Feel free to try this approach on your own and see if you can improve the performance! As always, don’t forget to check back here for more content like this. We also have many informative videos on the Altair suite of software on our YouTube channel. And if you are ever unable to find the information you are looking for, please reach out to us directly with any questions or comments!